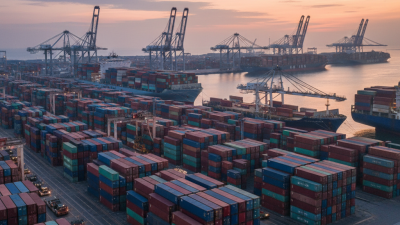
Why Are Sea Container Prices So High?
At first glance, a sea container looks like a simple steel box. Its price tells a more complicated story. A standard 20-foot unit requires weather-resistant steel, treated flooring, secure doors, and strict manufacturing checks. Small design differences can affect the final quote.
Manufacturing costs are only one part of the explanation. Steel prices, factory wages, energy bills, and transport expenses influence production. Container factories are also concentrated in a few Asian manufacturing centers. When orders rise quickly, production slots become limited. Prices can move before new containers reach local suppliers.
Global trade patterns create another pressure point. Containers often travel full in one direction and return empty. Repositioning those empty units costs fuel, labor, and port fees. Congested terminals can delay equipment, tightening supply in specific regions. A shortage in one port may exist while another port has unused stock.
Freight rates also matter. During major disruptions, carriers may prioritize available equipment for high-demand routes. Leasing companies and traders then adjust prices according to replacement costs and local availability. This can make a used container surprisingly expensive.
Condition matters greatly.
A new, wind-and-watertight unit usually costs more than an older storage box. Delivery distance, crane access, customization, tax, and inspection fees can change the invoice. Some online prices exclude these charges, creating an incomplete comparison.
The market is not always easy to read. Price reports may use different grades, locations, and delivery terms. Buyers should request a written quote, confirm dimensions, inspect the doors and floor, and ask about delivery timing. The clearest answer is practical: sea container prices rise when materials, movement, and immediate availability become expensive at the same time. Yet every region behaves differently, so broad global explanations should be checked against local evidence.
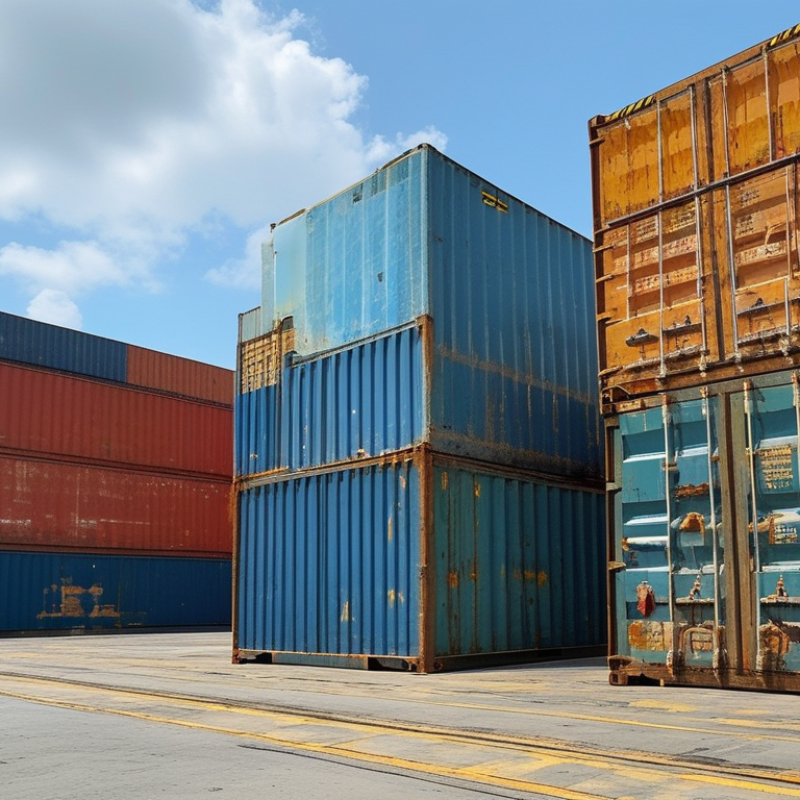
What Determines the Price of a Sea Container?
A sea container’s price depends on more than steel and doors. Size is the first major factor. A standard 20-foot unit usually costs less than a 40-foot high-cube model because it uses fewer materials and occupies less transport space. Special designs, such as refrigerated or open-top containers, require additional equipment and maintenance. That extra engineering appears directly in the quotation.
Condition also changes the price sharply. A newer container may have clean floors, working door seals, and minimal rust. Used units can be cheaper, but repairs may quickly reduce the saving. I once underestimated a small floor repair. The final cost was not small. Inspection records, cargo-worthiness standards, and the container’s age deserve careful attention before purchase.
Location often surprises buyers. A container near a busy port may cost less because supply is high. Inland buyers may pay more for trucking, handling, storage, and fuel. Seasonal demand can raise prices when exporters need more equipment. Currency movements and regional shortages also influence local quotations. The advertised price may exclude delivery, taxes, lifting, or preparation. Ask for an itemized estimate. It is less exciting, but more reliable. Market conditions change quickly, so a price viewed today may not remain valid next week. A careful comparison should consider total delivered cost, expected service life, and repair risk rather than the lowest initial number.
Sea container prices are mainly influenced by container type, steel and manufacturing costs, global availability, transport expenses, and regional demand. The figures below show indicative 2024–2025 market price ranges for commonly traded containers in USD; actual prices vary by condition, location, age, certification, and delivery cost.
How Global Trade Disruptions Increase Container Costs
Why Are Sea Container Prices So High?
How Global Trade Disruptions Increase Container Costs
Sea container prices rise when global trade loses its normal rhythm. A vessel delay can strand thousands of boxes at one port. Importers then face fewer empty containers nearby. Scarcity raises leasing, repositioning, and shipping charges. A box waiting outside a congested terminal still costs money. Storage, handling, insurance, and financing continue by the day. Every hour matters.
Recent disruptions show how quickly costs spread. Conflict-related rerouting can add days or weeks to a voyage. Severe weather may close channels, slow cranes, or interrupt inland rail service. Factory shutdowns and sudden demand surges create another imbalance. Containers can pile up where exports are weak. Meanwhile, manufacturers elsewhere compete for available equipment. Freight quotes may change before a booking is confirmed.
Reliable cost analysis requires more than checking one online rate. Logistics teams should compare port records, equipment availability, fuel expenses, and transport capacity. They should also separate the container’s purchase price from the freight rate. These figures often move differently. The market is not perfectly rational, either. Fear can push prices above practical costs for a while. Forecasts can be wrong. I have seen small scheduling changes create large invoice differences, especially when cargo misses a planned connection. Better planning helps, but it cannot remove every disruption.
| Disruption or Cost Driver | Relevant Period | Verified Indicator | Observed Data | How It Increased Container Costs | Data Source |
|---|---|---|---|---|---|
| COVID-19 demand shock | 2020–2021 | Global container port throughput | Approximately 802 million TEUs in 2019, rising to about 816 million TEUs in 2020 and continuing to grow in 2021. | Goods demand recovered faster than shipping schedules, inland transport, and port labor capacity. This created equipment shortages and higher freight rates. | UNCTAD, Review of Maritime Transport |
| Port congestion | 2020–2022 | Container vessel waiting time and terminal dwell time | Major ports in North America, Europe, and Asia experienced prolonged vessel queues and longer container storage periods during the disruption peak. | Containers remained trapped at terminals or on vessels for longer periods, reducing the number of boxes available for new export bookings. | UNCTAD and international port performance reports |
| Suez Canal blockage | March 2021 | Duration and trade exposure | The blockage lasted approximately six days. The Suez route normally carries about 12% of global trade by volume. | Ship diversions, schedule disruption, vessel bunching, and delayed equipment repositioning tightened capacity and increased voyage costs. | Suez Canal Authority and UNCTAD |
| Container equipment imbalance | 2020–2022 | Empty-container availability | Exporters in several regions faced shortages of empty 20-foot and 40-foot containers while import-heavy ports accumulated equipment. | Carriers and logistics providers had to reposition empty containers over long distances, adding handling, fuel, storage, and repositioning expenses. | UNCTAD and international maritime logistics statistics |
| Spot freight-rate escalation | 2019–2022 | Global container spot-rate index | Average spot rates on major global routes increased several-fold from pre-pandemic levels, reaching a peak in late 2021 before declining during 2022. | Limited short-term vessel and equipment capacity allowed freight prices to rise sharply when cargo demand exceeded available transport supply. | Public international container freight-rate indices |
| Fuel price inflation | 2021–2022 | Marine fuel and crude-oil prices | Global crude-oil prices rose substantially in 2021 and increased further after the geopolitical shock in 2022. | Higher bunker fuel bills increased the cost of operating vessels, trucking containers, rail services, and port equipment. | World Bank Commodity Markets Outlook and International Energy Agency |
| Reduced schedule reliability | 2020–2022 | On-time arrival performance | Global container schedule reliability fell to exceptionally low levels during 2021, with on-time performance below one-third on many reported services. | Unreliable schedules caused missed connections, extra storage, emergency bookings, and greater safety-stock requirements for shippers. | Global container shipping schedule reliability indices |
| Limited short-term fleet flexibility | 2020–2021 | Container vessel capacity growth | Fleet capacity expanded gradually, while cargo demand and port delays increased much faster during the peak disruption period. | New vessels require years to design, finance, build, and deliver, so supply could not respond quickly to the sudden increase in demand. | UNCTAD, Review of Maritime Transport |
| Container manufacturing cost pressure | 2020–2022 | Steel and production-input costs | Steel prices, energy costs, labor expenses, and inland transport charges rose during the period of strong container demand. | Higher production and delivery costs increased the purchase price and leasing cost of new dry containers. | World Bank commodity data and UNCTAD maritime market analysis |
| Trade-route disruptions and rerouting | 2022–2024 | Longer sailing distances and additional transit days | Security incidents and restrictions on selected maritime routes caused some vessels to take longer alternative routes. | Longer voyages consumed more fuel and vessel-days, effectively reducing available capacity and increasing insurance and operational expenses. | UNCTAD, Global Trade Update, and international maritime security reports |
| Storage and detention charges | 2020–2022 | Container dwell time at ports and inland terminals | Extended dwell times became common during periods of congestion, with containers remaining in terminals beyond normal free-time periods. | Importers and exporters faced additional storage, demurrage, detention, and truck waiting charges, increasing the total landed cost of each container. | Port authority statistics and international logistics studies |
| Normalization after the disruption peak | Late 2022–2024 | Freight-rate movement and equipment availability | Spot freight rates declined from their 2021 peak as consumer demand moderated, congestion eased, and more vessel capacity entered service. | Lower utilization reduced pressure on container availability, although route-specific disruptions and fuel costs continued to create volatility. | UNCTAD and public international freight-market indices |
Why Manufacturing, Materials, and Labor Affect Prices
Why Are Sea Container Prices So High?
Why Manufacturing, Materials, and Labor Affect Prices
A sea container is a steel structure built for repeated loading, lifting, and outdoor exposure. Its price begins with specialized steel, not an ordinary sheet from a local workshop. Manufacturers cut, shape, weld, and reinforce each panel with tight dimensional controls. Even a small alignment error can affect door seals or stacking safety.
Material costs can change quickly. Steel coils, flooring, corner castings, protective coatings, and locking hardware all influence the final quote. Marine-grade paint also requires preparation, drying time, and quality checks. These details are easy to overlook. They still add real cost.
Labor is another major factor. Skilled workers operate cutting equipment, welding stations, cranes, and inspection tools. They also check welds, door movement, floor strength, and coating coverage. Safety training and factory maintenance increase production expenses, but they reduce preventable failures. That balance is not always simple.
Manufacturing volume matters too. When factories receive fewer orders, fixed costs spread across fewer units. Production becomes less efficient. Transporting heavy, empty containers between factories, ports, and storage yards can add further charges. Exchange rates and regional steel supply may change the final price again.
A basic explanation can miss important variables. Not every price increase comes from expensive steel. Sometimes labor shortages, limited factory capacity, or delivery delays matter more. The estimate is never perfect. Buyers should compare specifications, inspection standards, delivery terms, and actual condition before judging whether a container is expensive.
How Shipping Demand and Port Congestion Shape Container Rates
Sea container prices rise when shipping demand grows faster than available vessel space. The pressure often starts with retail restocking, seasonal exports, or sudden changes in manufacturing. When bookings fill early, carriers can raise rates for limited space. Space disappears fast. Empty containers may also collect in the wrong regions, creating shortages where exporters need them most. Moving those empty units costs money and time.
Port congestion makes the situation more expensive. At a busy terminal, containers can wait several days before trucks collect them. Ships may queue outside, while cranes handle cargo more slowly. These delays reduce the number of trips each vessel can complete. Importers then compete for fewer usable departures. Storage charges, truck waiting fees, and schedule changes can add further pressure. A low ocean quote may not reflect the full transport cost.
In practice, logistics teams watch booking data, port dwell times, and equipment availability together. Demand alone does not explain every rate increase. A quiet trade lane can still face high prices after weather disruptions or uneven container flows. The market is not perfectly predictable. Forecasts can miss local bottlenecks by only a few days, yet those days matter. Better planning helps, but it cannot remove every delay. Flexible shipping dates and earlier bookings usually reduce exposure, though they may not suit urgent cargo.
How Container Availability Influences Regional Price Differences
Why Are Sea Container Prices So High?
This imbalance often begins with trade flows. Containers move full toward high-demand markets but return empty or wait for new cargo. After several weeks, inland depots may have too few units for exporters. A factory near an inland rail hub might pay more for a container than a coastal exporter. Distance matters too. Repositioning an empty unit requires trucks, rail capacity, labor, fuel, and handling time. Those costs enter regional quotations.
Small details can change the price. A shortage of refrigerated, high-cube, or specialized containers usually creates a wider gap. Seasonal exports can also drain equipment from one area within days. Port congestion makes the problem worse by delaying returns. Buyers then compete for containers that are physically nearby but operationally unavailable.
From my experience reviewing logistics quotes, availability is often more important than the headline global rate. However, this explanation is not complete. Contract terms, detention rules, cargo weight, and inland delivery can alter the final bill. A lower ocean rate may hide expensive repositioning charges. Check the equipment location, release date, and return conditions before comparing offers. It is an imperfect method, but it prevents many misleading comparisons.
Related Posts
-
China Top Sea Can Container Suppliers for Global Buyers?
-
China Best Options for Order Shipping Container Solutions?
-
What is a Sea Container and How to Buy One?
-
What is a Cargo Container and How is it Used?
-
How to Choose the Right Sea Container for Your Business Needs?
-
2026 Top Trends in Purchasing Shipping Containers for Your Business